Category: Concrete vs Alternatives

Side-by-side comparisons of concrete against asphalt, pavers, gravel, and more — covering real costs, lifespan, maintenance, and which material actually makes sense for your project.

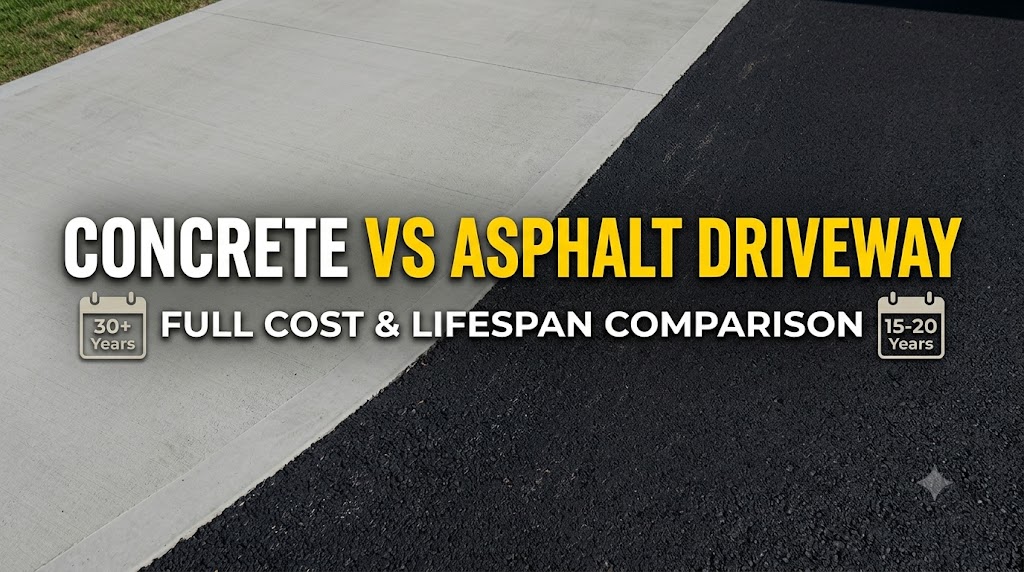
  • Concrete vs Asphalt Driveway: Full Cost & Lifespan Comparison

    Concrete vs Asphalt Driveway: Full Cost & Lifespan Comparison

    Concrete driveways cost $6–$12 per sq ft / £50–£100 per m² installed and last 30–50 years. Asphalt driveways cost $3–$7 per sq ft / £25–£60 per m² and last 15–30 years. The lower upfront cost of asphalt comes with higher long-term maintenance and a shorter service life — so which one actually costs less depends almost entirely on how long you plan to own the property.

    For a standard two-car driveway of 640 sq ft / 60 m², the installed cost difference between the two materials typically ranges from $1,900 to $3,200 / £1,500–£2,500. Use the concrete vs asphalt driveway cost comparison calculator to enter your exact dimensions and get a side-by-side number for your region.

    How do concrete and asphalt driveway costs compare?

    The cost gap between concrete and asphalt is real but narrower than most homeowners expect once you factor in maintenance cycles. Asphalt requires sealcoating every 3–5 years at $0.15–$0.25 per sq ft ($1.60–$2.70 per m²) and crack filling at intervals throughout its life. Over 30 years, a maintained asphalt driveway accumulates roughly $1,200–$2,000 in maintenance costs for a 640 sq ft surface. Concrete’s 30-year maintenance cost for the same area runs $400–$900, primarily sealing every 5–10 years.

    Replacement cost is the other factor. When asphalt reaches the end of its life at 15–20 years, you are looking at full removal and repaving at $3–$6 per sq ft. A concrete driveway on the same timeline may need resurfacing rather than replacement — concrete resurfacing costs typically run $3–$5 per sq ft / £25–£45 per m², versus full tear-out and replacement at $8–$15 per sq ft.

    FactorConcreteAsphalt
    Installed cost (per sq ft)$6–$12$3–$7
    Installed cost (per m²)£50–£100£25–£60
    Typical lifespan30–50 years15–30 years
    Sealcoating requiredEvery 5–10 years (optional)Every 3–5 years (required)
    Crack repair frequencyLowModerate–High
    30-year maintenance (640 sq ft)$400–$900$1,200–$2,000
    Resists oil stainsYes (sealed)No — oil degrades asphalt
    Heat toleranceExcellentSoftens above 120°F / 49°C
    Cold/freeze-thaw performanceGood with air entrainmentGood — flexible in cold
    Colour optionsYes (stained/stamped)Limited — black only

    Which material lasts longer?

    A well-installed concrete driveway with a 4-inch / 100 mm slab, proper subbase, and control joints every 8–10 ft / 2.4–3 m will outlast an asphalt driveway by 10–20 years in most climates. The key variable is installation quality: a concrete driveway poured on unstable fill or without adequate reinforcement will fail in under 10 years, while a properly compacted asphalt driveway on a good base can reach 25 years.

    Asphalt performs better in climates with extreme freeze-thaw cycling because it flexes slightly rather than cracking. However, it softens in intense summer heat — in regions where ground temperatures exceed 120°F / 49°C, asphalt can rut under heavy vehicle loads. Concrete, by contrast, handles heat well but is more prone to cracking if the subgrade settles unevenly or control joints are improperly placed.

    In freeze-thaw climates (most of Canada, the northern US, northern UK, and alpine regions), air-entrained concrete is essential — the entrained air voids accommodate ice expansion. Standard concrete without air entrainment in these climates will begin surface scaling within 5–10 winters.

    Common mistakes when choosing or installing either material

    Skipping the subbase preparation is the most expensive mistake on either surface. Asphalt and concrete both require 4–8 inches / 100–200 mm of compacted gravel base. Without it, settlement cracks appear within 2–5 years regardless of which surface is on top. This is not a material problem — it is a site prep problem that neither material can compensate for.

    Pouring concrete too thin is a common DIY error. The minimum for residential driveways is 4 inches / 100 mm; 5 inches / 125 mm is recommended where vehicles heavier than 3,500 lb / 1,600 kg park regularly. Pouring at 3 inches / 75 mm to save material produces a slab that will crack within the first winter in cold climates or under normal vehicle loads within 3–7 years.

    Ignoring expansion and control joints in concrete is another installation failure. Slabs need control joints every 8–10 ft / 2.4–3 m to direct cracking. Without them, thermal expansion produces random, uncontrolled cracking across the surface. The concrete expansion joint spacing calculator gives the correct spacing based on slab thickness and local temperature range.

    Choosing asphalt based on initial price alone without accounting for maintenance cycles leads to cost shock 5–10 years in. Homeowners who budget only for installation often find that deferred maintenance (letting small cracks grow, skipping sealcoating) accelerates surface deterioration and ultimately requires full replacement sooner than the material’s rated lifespan.

    Related calculators you might need

    If you are leaning toward concrete, the concrete driveway calculator gives you exact volume, bag count, and ready-mix quantity for your dimensions. For cost modelling, the concrete cost per square foot calculator lets you input local pricing to get a project total. If the driveway is already in place and you are weighing repair against replacement, the concrete resurfacing calculator and the concrete demolition and removal cost estimator give you the numbers to make that call clearly.

    Frequently asked questions

    Is concrete or asphalt cheaper for a driveway?

    Asphalt is cheaper to install — typically $3–$7 per sq ft versus $6–$12 for concrete. Over a 30-year period, concrete is usually cheaper when you account for asphalt’s mandatory sealcoating cycles and earlier replacement. The break-even point is approximately 12–18 years for most regions. Use the concrete vs asphalt driveway cost comparison calculator to model this for your specific driveway size.

    How long does a concrete driveway last compared to asphalt?

    A properly installed concrete driveway lasts 30–50 years. Asphalt lasts 15–30 years with regular maintenance. In cold climates with hard freeze-thaw cycles, both materials perform closer to the lower end of those ranges unless installed correctly — concrete needs air entrainment, asphalt needs a well-compacted base and regular sealing.

    Does concrete crack more than asphalt?

    Concrete can crack if control joints are improperly placed or the subgrade settles. Asphalt also cracks but is more flexible, so cracks tend to be smaller and easier to fill in the short term. Over time, asphalt crack damage is cumulative — water enters cracks, erodes the base, and accelerates surface failure. Properly jointed concrete directs cracking to predictable locations and resists moisture penetration better.

    Which driveway surface performs better in hot climates?

    Concrete performs significantly better in hot climates. Asphalt softens at surface temperatures above 120°F / 49°C, which can cause rutting under parked vehicles. In the US Southwest, Australia, and the Middle East, asphalt driveways frequently show tyre marks and surface deformation in summer. Concrete does not soften in heat and maintains structural integrity across a wider temperature range.

    Can I resurface an old concrete driveway instead of replacing it?

    Yes, if the existing slab is structurally sound with no deep cracking or significant settlement. Resurfacing overlays typically add 1–2 inches / 25–50 mm of material and cost $3–$5 per sq ft / £25–£45 per m² — considerably less than full replacement. Resurfacing does not fix structural problems underneath; if the base has failed, replacement is the correct approach.

    What is the maintenance difference between concrete and asphalt driveways?

    Asphalt requires sealcoating every 3–5 years — this is not optional if you want the surface to reach its rated lifespan. Concrete can be sealed every 5–10 years but tolerates neglect better. Asphalt also requires annual inspection and crack filling to prevent water infiltration. Concrete maintenance is primarily cosmetic unless structural cracks develop, which are less common in properly installed slabs.
  • Concrete vs Gravel Driveway: Real Cost Breakdown by Country

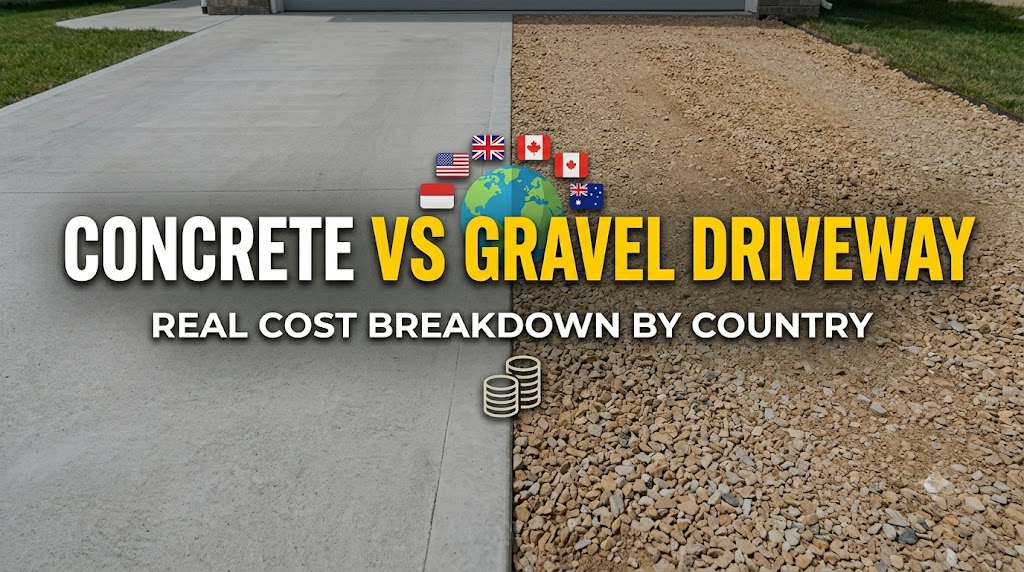
    Concrete vs Gravel Driveway: Real Cost Breakdown by Country

    Gravel driveways cost $1–$3 per sq ft / £8–£25 per m² installed, making them 4–8× cheaper than concrete to put in. That gap narrows significantly when you account for annual top-up costs, regrading every 3–5 years, and the labour involved in keeping loose stone where it belongs. A concrete driveway costs $6–$12 per sq ft / £50–£100 per m² but has no ongoing material cost and does not require regrading. For driveways over 150 ft / 45 m in length, concrete’s maintenance advantage compounds substantially over a 20-year period.

    For concrete quantity and cost, use the concrete driveway calculator. For gravel volume, the gravel / crushed stone calculator converts your driveway dimensions and depth into tonnes and cubic yards.

    What does a concrete vs gravel driveway cost in the US, UK, Canada, and Australia?

    Prices vary significantly by region. The table below uses a standard two-car driveway of 640 sq ft / 60 m² as the reference area.

    CountryGravel InstalledConcrete InstalledGravel Annual Top-UpConcrete 10-yr Maintenance
    United States$640–$1,920$3,840–$7,680$150–$400/yr$300–$600 total
    United Kingdom£480–£1,500£3,000–£6,000£100–£300/yr£200–£500 total
    Canada (CAD)CAD 900–2,500CAD 6,000–13,000CAD 200–500/yrCAD 400–900 total
    Australia (AUD)AUD 960–2,880AUD 5,760–12,000AUD 200–450/yrAUD 350–800 total

    Gravel annual top-up costs assume a 2-inch / 50 mm replenishment layer every 3–4 years and regrading after snowplowing or heavy rain. Concrete 10-year maintenance assumes one sealing treatment at years 5 and 10. On a 20-year basis, the cost difference between the two materials for a 640 sq ft / 60 m² driveway is typically $1,500–$4,000 / £1,200–£3,000, with concrete ahead on total cost in most scenarios beyond the 10-year mark.

    Where does gravel outperform concrete — and where does it fall behind?

    Gravel is the correct choice for long rural driveways where the per-square-foot cost of concrete becomes prohibitive. A 300 ft / 90 m driveway at 12 ft / 3.6 m wide covers 3,600 sq ft / 335 m². At $6–$12 per sq ft, concrete costs $21,600–$43,200 for that run. Gravel at $1–$3 per sq ft runs $3,600–$10,800. On rural properties where the driveway sees light use and aesthetic expectations are lower, that $18,000–$32,000 difference is decisive.

    Concrete becomes the correct choice where the driveway is short (under 100 ft / 30 m), heavily used, or subject to local authority requirements — many UK councils and Australian local governments require planning permission or technical compliance for surfaces over a certain area, and concrete is easier to design for drainage compliance than loose gravel.

    In regions with heavy snow and regular plowing — the northern US, Canada, and the UK uplands — gravel driveways lose material every winter when plows pull gravel off the surface. This is the primary driver of top-up costs in cold climates. In these regions, concrete or asphalt surfaces consistently have lower 10-year total costs unless the driveway exceeds 200 ft / 60 m in length.

    ConditionRecommended SurfaceReason
    Driveway under 100 ft / 30 mConcreteCost-effective; no regrading needed
    Driveway over 300 ft / 90 m (rural)GravelInstallation cost differential too large
    Heavy snow + regular plowingConcreteGravel loses material each winter
    Drainage-sensitive propertyGravel or permeable concreteGravel infiltrates; solid concrete must be graded
    High-traffic residentialConcreteGravel tracks indoors; concrete holds position
    Rental or investment propertyConcreteLower maintenance; no annual top-up cost
    Budget-constrained large siteGravel now, concrete laterGravel buys time; concrete over compacted base later

    Common mistakes when choosing or installing either surface

    Installing gravel without a geotextile fabric under the base layer is the most common installation error. Without fabric, gravel gradually sinks into soft subsoil, the surface becomes uneven within 2–3 years, and regrading requires significantly more material because the original stone has migrated downward. A single layer of woven geotextile fabric, laid before the gravel base, prevents this and extends the functional life of the driveway by 5–8 years.

    Using the wrong gravel type is equally problematic. Round river rock or pea gravel does not compact or bind — it rolls underfoot and under tyre. The correct material for driveways is crushed angular stone: #57 or #21A stone in the US, MOT Type 1 in the UK, ¾ inch crusher run in Canada and Australia. Angular edges bind when compacted, and the fines fill the voids between larger pieces. For accurate volume in tonnes, use the gravel / crushed stone calculator with your driveway dimensions and the correct depth (typically 4 inches / 100 mm compacted).

    Pouring concrete on an inadequate base is the equivalent error on the concrete side. A 4-inch / 100 mm concrete slab requires a minimum 4 inches / 100 mm of compacted gravel subbase. Skipping the subbase and pouring directly on native soil produces a slab that settles unevenly and cracks within 3–5 years, particularly in clay-heavy soils that expand when wet and shrink when dry. The concrete driveway calculator includes base material volume so you can cost both layers accurately.

    Choosing gravel based on initial cost alone without accounting for snowplow damage leads to annual maintenance costs that exceed projections. Homeowners who plan for a $150 annual top-up in a heavy-snow climate often spend $400–$700 every spring replacing material displaced by plowing. In these regions, the break-even calculation strongly favours concrete within 8–12 years.

    Related calculators you might need

    If you decide on concrete, the concrete driveway calculator handles volume and ready-mix quantity, and the concrete cost per square foot calculator lets you input local pricing for a full project budget. For gravel, the gravel / crushed stone calculator converts dimensions to tonnes and cubic yards for ordering. If you want a formal project cost comparison before committing, the full concrete project estimator covers material, delivery, and labour line items.

    Frequently asked questions

    Is a gravel driveway cheaper than concrete?

    Yes, upfront — gravel costs $1–$3 per sq ft / £8–£25 per m² installed versus $6–$12 for concrete. For a standard two-car driveway of 640 sq ft / 60 m², that is a $3,200–$5,700 difference at the time of installation. Over 15–20 years, concrete is typically cheaper because it has no annual material replacement cost and does not require regrading. The break-even point is approximately 10–14 years for most driveways in moderate climates.

    How long does a gravel driveway last?

    A properly installed gravel driveway with a compacted base and geotextile fabric lasts indefinitely as a surface type — but it requires ongoing material top-up and regrading every 3–5 years. The base itself can last 20+ years. Unlike concrete, there is no singular failure point; gravel simply disperses and requires replenishment. Annual maintenance keeps the surface functional, but it is never a hands-off driveway the way concrete is after curing.

    Can I pave over a gravel driveway with concrete?

    Yes, but the gravel base must be assessed first. If the existing gravel is well-compacted, stable, and at the right depth (4+ inches / 100 mm), it can serve as the subbase for a concrete pour. If the gravel has migrated, is contaminated with soil, or is less than 4 inches / 100 mm thick, it needs to be removed, regraded, and compacted before pouring. Pouring concrete over a soft or uneven gravel base produces a slab that will crack within a few years.

    What gravel is best for driveways in the UK?

    MOT Type 1 (crushed limestone or granite hardcore) is the standard driveway sub-base material in the UK, typically laid at 4–6 inches / 100–150 mm compacted depth. For the wearing surface, 20mm angular gravel or shingle provides good traction and drainage. Round shingle or pea gravel is not recommended as a primary wearing surface — it disperses under tyres and provides poor traction in wet conditions. Some UK councils also require a permeable surface for front garden driveways under the 2008 permitted development rules.

    Does a gravel driveway need planning permission?

    In England, Wales, and Scotland, permeable surfaces (including gravel) for front gardens under 5 m² / 54 sq ft do not require planning permission. Impermeable surfaces over that threshold — including concrete — require either planning permission or drainage to a soakaway, as established under the 2008 permitted development rules for front gardens. In Australia, local council rules vary significantly by state; generally, driveways over 30 m² / 320 sq ft require a development application in most jurisdictions. In the US, driveway regulations are municipality-specific — check your local zoning code.

    How much gravel do I need for a driveway?

    A standard two-car driveway (20 ft × 20 ft / 6 m × 6 m) at 4 inches / 100 mm compacted depth requires approximately 2.5 cubic yards / 1.9 m³ of crusher run, which is roughly 3.5 US tons / 3.2 metric tonnes. Use the gravel / crushed stone calculator to enter your exact dimensions and get tonnage and cubic yard figures for ordering — suppliers typically quote in tonnes, not cubic yards.

  • Concrete vs Pavers: Which Lasts Longer and Costs Less?

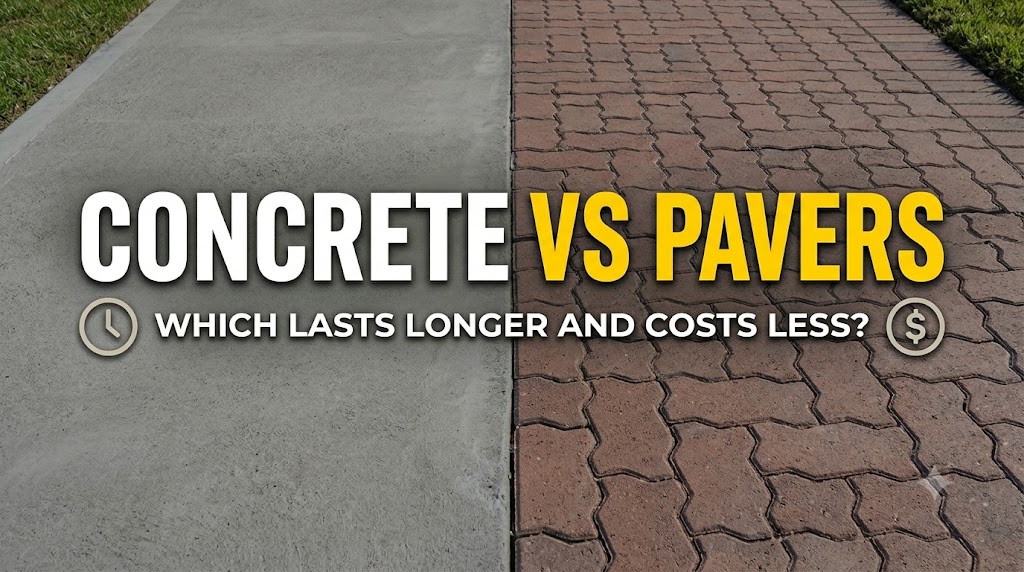
    Concrete vs Pavers: Which Lasts Longer and Costs Less?

    Poured concrete costs $6–$12 per sq ft / £50–£100 per m² installed and lasts 30–50 years. Concrete pavers cost $10–$20 per sq ft / £80–£160 per m² installed and last 25–50 years. Pavers cost more upfront but can be repaired unit-by-unit; a poured slab, once cracked, requires patching or full resurfacing. Which costs less over time depends on soil stability, drainage, and how much aesthetic flexibility matters.

    The paver calculator calculates the number of pavers, sand, and base material needed for your area. For poured concrete, use the concrete patio calculator or the concrete driveway calculator depending on the application.

    How do poured concrete and pavers compare on cost and durability?

    The installed cost gap between pavers and poured concrete ranges from $4 to $8 per sq ft / £30–£60 per m², depending on paver material (concrete pavers vs clay brick vs natural stone) and local labour rates. The table below uses a 400 sq ft / 37 m² patio as a reference.

    FactorPoured ConcreteConcrete Pavers
    Installed cost (per sq ft)$6–$12$10–$20
    Installed cost (per m²)£50–£100£80–£160
    Typical lifespan30–50 years25–50 years
    Repair methodPatch or resurfaceReplace individual units
    Repair cost$3–$5/sq ft resurfacing$1–$5 per unit replaced
    Settlement toleranceLow — cracks under movementHigh — re-level individual units
    Freeze-thaw performanceGood with air entrainmentGood — joints absorb movement
    Permeable optionPervious concrete (specialist)Permeable paver systems
    Design flexibilityLimited (staining, stamping)High — colours, patterns, shapes
    Long-term maintenanceSealing every 5–10 yearsJoint sand replenishment; re-levelling

    Which surface holds up better over time?

    Poured concrete is a monolithic surface — its strength comes from continuity. When the subgrade beneath it settles, the slab develops cracks rather than accommodating the movement. In stable soil conditions with a properly prepared base, poured concrete at 4 inches / 100 mm with air entrainment and correct joint placement reaches 30–50 years without significant structural repair. In areas with expansive clay soils, tree roots, or frequent freeze-thaw cycling, settlement cracking can appear within 5–10 years.

    Pavers distribute loads across individual units joined by compacted sand. When settlement occurs beneath them, individual pavers drop or tilt rather than cracking. A contractor can lift and re-level a settled section, replace damaged units, and tamp the base without disturbing the rest of the surface. This repairability is pavers’ primary structural advantage. The downside is that joint sand requires periodic replenishment — typically every 3–7 years — and weed growth in joints is a maintenance reality unless polymeric sand is used.

    In applications where soil stability is questionable — tree-lined areas, clay-heavy sites, or regions with high frost heave — pavers consistently outperform poured concrete on long-term maintenance cost. In stable, well-drained conditions, poured concrete is the lower-maintenance option once installed.

    Common mistakes when choosing or installing either surface

    Installing pavers on an inadequate base is the most common failure. The paver itself is rarely what breaks — it is the 4–6 inch / 100–150 mm compacted gravel base beneath it that determines longevity. Contractors cutting base depth to reduce cost produce paver installations that begin settling within the first winter. A proper paver base requires compacted crushed aggregate, not just sand, under the bedding layer.

    Pouring concrete too thin under heavy loads is equally problematic. A 4-inch / 100 mm slab handles standard passenger vehicles. Where SUVs, delivery trucks, or equipment over 3,500 lb / 1,600 kg will park, 5 inches / 125 mm is the minimum. Poured at 3 inches / 75 mm — common when contractors try to save a cubic yard — residential driveways and aprons crack within 3–5 years under vehicle loads.

    Skipping polymeric sand on a paver installation is a short-term saving that causes long-term joint problems. Standard jointing sand washes out during rain, allowing weed germination and ant colonisation. Polymeric sand cures to a semi-rigid joint that resists both. The polymeric sand calculator estimates the quantity needed for your joint dimensions and paver pattern.

    Ignoring drainage direction on poured concrete leads to surface pooling and accelerated freeze-thaw damage. Concrete surfaces need a minimum slope of 1/8 inch per foot / 1% grade away from structures. Many DIY and some contractor pours fail this basic requirement, resulting in standing water, efflorescence staining, and surface spalling within a few winters.

    Related calculators you might need

    If you decide on pavers, the paver calculator handles unit count, base material, and sand quantities. The polymeric sand calculator covers joint fill quantities based on paver size and pattern. For the concrete route, use the concrete patio calculator to get volume and cost inputs, and the stamped concrete calculator if you want a decorative finish that competes visually with pavers at a lower installed cost.

    Frequently asked questions

    Do pavers last longer than concrete?

    Both materials have similar potential lifespans — 25–50 years for pavers, 30–50 years for poured concrete. In practice, pavers often outlast poured concrete in real-world conditions because individual units can be replaced without disturbing the whole surface. A cracked concrete slab cannot be repaired invisibly; a cracked paver can be swapped in minutes. Longevity ultimately depends more on base preparation and installation quality than on the surface material.

    Are pavers or concrete cheaper for a patio?

    Poured concrete is cheaper upfront — $6–$12 per sq ft versus $10–$20 for pavers. For a 400 sq ft / 37 m² patio, this represents a difference of $1,600–$3,200. Over 20–30 years, pavers can be cheaper if the concrete slab requires resurfacing or extensive crack repair, since pavers allow targeted unit replacement rather than surface-wide repair. For flat, stable ground with good drainage, concrete is the better value. For sites with trees, clay soil, or freeze-thaw risk, pavers typically win on 20-year total cost.

    What is the main disadvantage of pavers compared to poured concrete?

    Cost and maintenance complexity. Pavers cost 1.5–2× more to install. They also require joint sand replenishment every few years, periodic re-levelling if settlement occurs, and regular sweeping to prevent organic debris from establishing in joints. For homeowners who want a surface installed and forgotten, poured concrete sealed every 5–10 years is simpler to maintain.

    Can I pour concrete over existing pavers?

    In most cases, no — and it is not recommended. Pavers are installed on a sand-and-gravel base that is not engineered for concrete. Pouring concrete over pavers typically produces a slab that cracks within 1–3 years as the sand base beneath shifts. The correct approach is to remove the pavers, properly compact and prepare a concrete subbase, then pour. The concrete demolition and removal cost estimator helps budget for the removal phase.

    Which surface is better for drainage?

    Standard pavers with open joints drain better than solid concrete because water passes through the joints into the base. Permeable paver systems — with wider joints filled with gravel — achieve infiltration rates of 10–50 inches per hour / 250–1,270 mm per hour, which exceeds the capacity of most drainage events. Poured concrete is impermeable unless specifically designed as pervious concrete, a specialist product with coarser aggregate and no fine sand.

    Which is easier to repair — pavers or concrete?

    Pavers are far easier to repair. A single cracked or stained paver can be removed with two flathead screwdrivers, replaced, and re-sanded in under an hour. Concrete crack repair is more involved — products must be matched to crack width, and unless the underlying cause (settling, joint failure) is addressed, cracks typically return. The concrete crack repair calculator estimates material quantities if you are repairing an existing slab.

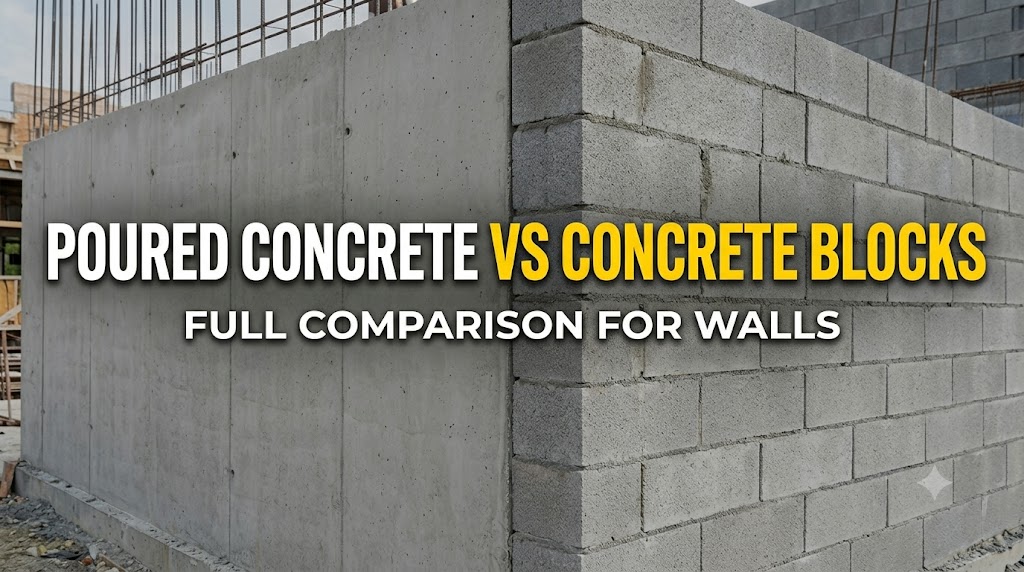
  • Poured Concrete vs Concrete Blocks for Walls: Full Comparison

    Poured Concrete vs Concrete Blocks for Walls: Full Comparison

    Poured concrete walls are 30–40% stronger in compression than equivalent-thickness CMU block walls and provide a continuous, monolithic barrier with no mortar joints. Concrete block (CMU) walls are faster to build with a small crew, require no formwork, and allow mid-project changes without waiting for cure time. The right choice depends on the application: below-grade foundations, above-grade retaining walls, and above-grade structural walls each have a different answer.

    Use the concrete foundation wall calculator to estimate concrete volume for a poured wall. For CMU construction, the concrete block / CMU calculator gives block count, mortar volume, and grout for filled cores.

    How do poured concrete and CMU walls compare structurally?

    Poured concrete derives its strength from a continuous mass of concrete — typically 3,000–4,000 PSI / 20–28 MPa for residential foundation walls, up to 5,000 PSI / 34 MPa for engineered structural walls. There are no joints to leak water or fail under lateral earth pressure. The compressive strength of poured concrete is fully uniform across the wall face when mix design, water-cement ratio, and consolidation are controlled correctly.

    CMU walls are built from individual 8×8×16 inch / 200×200×400 mm standard blocks (or other sizes) bonded with mortar. The mortar joints are the structural weak points — both in compression and, more critically, in water resistance. Grouted and reinforced CMU walls — where cores are filled with grout and vertical rebar is installed — approach poured concrete performance. Ungrouted CMU walls are significantly weaker and are not appropriate for below-grade or retaining wall applications.

    FactorPoured ConcreteCMU Block (Grouted & Reinforced)
    Compressive strength3,000–5,000 PSI / 20–34 MPa1,500–3,000 PSI / 10–20 MPa
    Water resistanceExcellent (monolithic)Moderate — joints require waterproofing
    Lateral earth pressure resistanceExcellentGood with full grouting and rebar
    Formwork requiredYes — adds cost and timeNo
    Cure time before backfill28 days (full strength)Can backfill after 7 days if grouted
    Labour skill requiredHigh (forming, pouring)Moderate (laying block)
    Material cost (per sq ft)$4–$8 wall face$3–$6 wall face (blocks only)
    Installed cost (per sq ft)$12–$25$10–$20
    Design flexibilityLimited after pourHigh — adjustable during build
    Seismic performanceExcellent with rebarGood with full reinforcement

    Which wall type is right for each application?

    Below-grade foundation walls: Poured concrete is the clear choice for most residential and commercial basements. The monolithic pour eliminates the primary path for groundwater infiltration — the mortar joint. CMU basement walls are used successfully but require more aggressive waterproofing treatment (dimple mat, drainage board, or crystalline waterproofing applied to the block face) to achieve equivalent below-grade moisture performance. In high water table conditions, poured concrete is strongly preferred by most structural engineers.

    Retaining walls: Both materials work for retaining walls under 4 ft / 1.2 m. Above that height, engineering calculations are required regardless of material, and poured concrete typically wins on cost-efficiency at heights of 6 ft / 1.8 m or more because the required thickness can be designed precisely. For landscape retaining walls, the concrete retaining wall calculator estimates concrete volume based on wall height, batter, and footing dimensions.

    Above-grade structural walls: CMU is widely used for above-grade commercial and residential construction in hurricane and seismic zones (Florida, the Caribbean, parts of California) because grouted CMU allows continuous vertical and horizontal reinforcement. In these applications, the speed advantage of CMU — no formwork — makes it more economical than poured concrete despite the higher block and mortar cost per square foot.

    Common mistakes when choosing or building either wall type

    Using ungrouted CMU for below-grade or retaining walls is the most structurally serious mistake. An ungrouted 8-inch / 200 mm CMU wall has roughly 25–35% of the lateral resistance of a poured concrete wall of the same thickness. Contractors build ungrouted CMU walls to cut material cost, but in below-grade conditions the wall typically cracks at mortar joints within 5–10 years under sustained earth pressure and hydrostatic load.

    Pouring a foundation wall without adequate rebar is the equivalent error on the concrete side. Building codes in the US, UK, Canada, and Australia all specify minimum reinforcement for poured concrete walls — typically #4 bars / 12 mm at 24-inch / 600 mm spacing for residential foundation walls. A wall poured without rebar is monolithic but brittle — it handles compressive loads but fails at the first significant flexural or lateral load event. The rebar / reinforcing steel calculator determines rebar quantity and weight for the wall dimensions.

    Backfilling against a poured concrete foundation before it reaches 70% of design strength — which takes approximately 7 days at 70°F / 21°C but 14+ days below 50°F / 10°C — is a common site management failure. The unbraced wall is subjected to lateral earth pressure before it can resist it. Wall deflection or cracking in this window is a structural defect, not a normal occurrence.

    Skipping waterproofing treatment on CMU below grade consistently causes moisture problems. Block is porous at the face and highly vulnerable at mortar joints. Applying a parge coat and elastomeric waterproofing — not just damp-proofing paint — is the minimum for a dry below-grade CMU wall. This adds $2–$4 per sq ft / £18–£36 per m² to the installed cost, which closes much of the apparent price gap between CMU and poured concrete for basement applications.

    Related calculators you might need

    For a poured concrete wall project, the concrete foundation wall calculator handles volume and mix quantity. The rebar spacing calculator confirms your reinforcement layout meets load requirements. For CMU construction, the concrete block / CMU calculator covers block count and the CMU core fill calculator handles grout volumes for filled cores. The mortar calculator rounds out the CMU cost estimate.

    Frequently asked questions

    Is poured concrete stronger than concrete block?

    Poured concrete at 3,000–4,000 PSI / 20–28 MPa is stronger in compression than standard CMU block walls, which achieve 1,500–3,000 PSI / 10–20 MPa grouted. More importantly, poured concrete is monolithic — there are no mortar joints to fail under lateral load or water pressure. For applications where lateral resistance and water tightness matter (basements, retaining walls above 4 ft / 1.2 m), poured concrete performs better than equivalent-thickness CMU in most conditions.

    Which is cheaper — poured concrete or block walls?

    Installed costs are close. CMU block walls run $10–$20 per sq ft / £85–£165 per m², poured concrete $12–$25 per sq ft / £100–£210 per m². The gap narrows further for taller walls where concrete formwork costs spread over more surface area, and when you add the waterproofing and additional rebar a below-grade CMU wall needs to match poured concrete performance. For walls over 8 ft / 2.4 m, poured concrete is often comparable or cheaper in total installed cost.

    How long does a poured concrete wall last versus a concrete block wall?

    Both materials last 50–100+ years in normal above-grade conditions. Below grade, poured concrete consistently outperforms CMU because it resists water infiltration at the structure level, not just at the surface treatment. Waterproofing on CMU can be renewed, but joint deterioration in high-moisture or chemically aggressive soils can reduce service life to 30–50 years. Poured concrete below grade in residential applications routinely exceeds 80 years without structural intervention.

    Do I need a structural engineer for a CMU or poured concrete wall?

    For walls over 4 ft / 1.2 m retaining soil, or any wall in a seismic zone, yes — engineering review is required under most US, Canadian, UK, and Australian building codes regardless of material. For residential foundation walls, pre-engineered tables in the IRC (US) and equivalent codes elsewhere specify minimum thickness and reinforcement for standard conditions. Non-standard conditions — high surcharge loads, poor soil bearing capacity, water table above footing — require a licensed engineer.

    Can concrete blocks be used for a basement wall?

    Yes, and they are commonly used. The key requirements are: full core grouting, vertical and horizontal rebar (typically #5 / 16 mm vertical at 32–48 inch / 800–1,200 mm spacing), and aggressive exterior waterproofing. An ungrouted CMU basement wall is not structurally adequate and will fail over time. Even properly built CMU basements require more attention to waterproofing than poured concrete — budget an additional $2–$5 per sq ft / £18–£45 per m² for waterproofing treatment.

    Which wall type is better in earthquake zones?

    Both perform well in seismic zones when properly engineered and reinforced. Grouted CMU with continuous vertical and horizontal rebar — as specified by ACI 530 in the US and equivalent standards in Canada, New Zealand, and Australia — is a proven seismic-resistant system. Poured reinforced concrete walls perform similarly. The critical variable in both cases is the continuity of reinforcement through the wall and into the footing, not the surface material.

  • Concrete Carbon Footprint vs Alternative Materials

    Concrete Carbon Footprint vs Alternative Materials

    Ordinary Portland cement (OPC) concrete produces approximately 0.8–1.0 kg CO₂e per kg of cement, making cement production responsible for roughly 8% of global CO₂ emissions. On a per-tonne basis, structural steel is three times worse, aluminium is fifteen times worse, and timber can be carbon-negative if sourced from sustainably managed forests. But material choice for construction is never made on embodied carbon alone — and the numbers change dramatically based on design lifespan, replacement cycles, and what you count in the system boundary.

    How to measure concrete carbon footprint: the numbers you need

    Embodied carbon is measured in kg CO₂ equivalent per cubic metre (kg CO₂e/m³) for volume-based materials like concrete, or per tonne for structural comparisons. The figures below are cradle-to-gate (extraction through manufacture, excluding transport and installation) based on published Environmental Product Declarations (EPDs) and the Inventory of Carbon and Energy (ICE) database v3.0.

    MaterialEmbodied Carbon (kg CO₂e/tonne)Embodied Carbon (kg CO₂e/m³)Structural Use Notes
    Standard concrete (25 MPa / 3,600 psi)~130310–340Slab, footing, general structural
    High-strength concrete (50 MPa / 7,250 psi)~180440–480Columns, bridges, parking structures
    Concrete with 50% GGBS replacement~65155–175Reduced clinker, lower early strength
    Concrete with 30% fly ash replacement~90215–235Common SCM blend, widely available
    Structural steel (virgin)~1,77013,900Beams, columns — very high density
    Structural steel (recycled content >80%)~480–7003,760–5,490Electric arc furnace, varies by grid
    Cross-laminated timber (CLT)-750 to -1,600 (biogenic)~250–400 (cradle-to-gate excl. carbon storage)Sequesters carbon while in use
    Aluminium (primary)~11,50031,050Rarely structural; cladding, frames
    Fired clay brick~240430–510Masonry walls
    Autoclaved aerated concrete (AAC) block~350190–220 (low density ~600 kg/m³)Non-structural and light structural

    To calculate the actual carbon output for a specific concrete project, use the Concrete Carbon Footprint Calculator — it outputs total CO₂e based on volume, mix design, and cement type.

    Why a direct per-tonne comparison between concrete and alternatives is misleading

    Structural materials are not interchangeable by mass. A concrete slab, a steel beam, and a CLT panel serving the same structural function contain different volumes and masses of material. The correct comparison is functional unit — the carbon required to achieve a specific structural outcome, not the carbon per tonne of each material in isolation.

    Concrete versus steel: Steel has roughly 13 times higher embodied carbon per cubic metre than standard concrete. However, steel’s high strength-to-weight ratio means far less of it is used to achieve the same load capacity. A steel-framed multi-storey building typically has lower total embodied carbon in the structural frame than an equivalent concrete frame — but the slab, which is almost always concrete regardless of frame material, often dominates total material carbon.

    Concrete versus timber (CLT): CLT stores biogenic carbon during its service life, making it carbon-negative on a cradle-to-gate basis when carbon sequestration is included. However, this carbon is released if the timber is burned or landfilled at end of life. The carbon benefit is time-bound and recovery-dependent. In a 60-year building lifespan, CLT may represent a genuine carbon advantage; in a 100-year concrete structure that outlasts multiple timber replacement cycles, the advantage narrows or reverses.

    Concrete versus AAC block: Autoclaved aerated concrete has lower embodied carbon per cubic metre than standard concrete due to its cellular structure and lower density, and it performs significantly better thermally. For non-structural partition walls and low-rise residential, AAC is a compelling alternative on both carbon and energy performance grounds. It does not compete with structural concrete on compressive strength.

    Strategies that actually reduce concrete carbon footprint

    Supplementary cementitious materials (SCMs): Replacing 30–50% of Portland cement with ground granulated blast-furnace slag (GGBS) or fly ash reduces embodied carbon by 35–50% with minimal impact on 28-day strength. GGBS mixes are already standard in UK infrastructure (BS 8500 CEM II/III mixes). Fly ash (pulverised fuel ash / PFA) is the North American equivalent. Both are industrial by-products that would otherwise require disposal.

    Optimised mix design: Over-specification of concrete strength is common — using 40 MPa (5,800 psi) concrete where 25 MPa (3,600 psi) is structurally adequate adds 30–40% embodied carbon for no structural benefit. Matching mix strength to actual design loads rather than defaulting to a high-strength mix is the simplest carbon reduction available.

    Reduce volume through structural efficiency: Thinner slabs with post-tensioning, ribbed slab systems, and optimised column grids use less concrete to achieve the same performance. Post-tensioned slabs are typically 20–30% thinner than equivalent reinforced concrete slabs, reducing embodied carbon proportionally. The Concrete Slab Thickness Selector helps identify the minimum structurally adequate thickness for your loading scenario.

    Concrete carbonation (reabsorption): Over its service life, concrete reabsorbs CO₂ from the atmosphere through a natural process called carbonation. Studies from the Journal of Cleaner Production (2016, Xi et al.) estimate that global concrete carbonation reabsorbs 43% of the CO₂ released during cement production — not counted in cradle-to-gate figures but relevant to whole-life assessments.

    Common mistakes in concrete carbon comparisons

    1. Comparing cradle-to-gate figures across different system boundaries. Some material EPDs include transport and installation (cradle-to-practical completion); others stop at factory gate. Comparing a cradle-to-gate concrete figure against a cradle-to-practical-completion CLT figure overstates the timber advantage. Always confirm what the system boundary includes before drawing conclusions.

    2. Ignoring service life and replacement cycles. A concrete structure with a 100-year design life versus a timber alternative requiring structural replacement or retreatment at 40–50 years means the concrete is producing one set of embodied carbon emissions against two or more cycles of timber production. Whole-life carbon accounting, not upfront carbon only, is the correct metric for long-lived structures.

    3. Treating biogenic carbon in timber as permanently sequestered. CLT’s carbon storage only benefits the climate if the wood is not burned or landfilled at end of life. End-of-life scenarios for buildings are difficult to predict over 50-100 year timescales. Carbon sequestration in buildings should be counted conservatively, especially in jurisdictions without established timber salvage or cascade-use infrastructure.

    4. Not accounting for the concrete already in the building. Structural steel frames still use concrete for slabs, foundations, and cores. Labelling a building as a ‘steel structure’ or ‘timber structure’ does not eliminate concrete’s carbon contribution — it just relocates it. Whole-building carbon accounting is the only way to compare construction systems accurately.

    Related calculators you might need

    The Concrete Carbon Footprint Calculator is the starting point for project-level carbon quantification. If you are evaluating whether recycled content concrete or GGBS blends change your numbers, the Concrete Mix Ratio Calculator lets you adjust cement proportions before running carbon estimates. Demolition and material substitution decisions often involve assessing whether existing concrete can be recycled — the Concrete Recycling Savings Calculator quantifies the carbon and cost benefit of crushing and reusing demolition concrete on-site. For projects comparing concrete versus asphalt specifically, the Concrete vs Asphalt Driveway Cost Comparison covers both cost and lifecycle context.

    Frequently asked questions

    How much CO₂ does concrete produce per cubic metre? Standard 25 MPa (3,600 psi) ready-mix concrete produces approximately 310–340 kg CO₂e per cubic metre at the point of manufacture. High-strength 50 MPa (7,250 psi) mixes reach 440–480 kg CO₂e/m³. Mixes using 50% GGBS replacement drop to 155–175 kg CO₂e/m³ — roughly half the carbon of standard OPC concrete.

    Is concrete worse for the environment than steel? Per tonne, structural steel is roughly 13 times more carbon-intensive than standard concrete. Per functional unit (achieving the same structural outcome), the comparison is closer, and steel-framed buildings can have lower frame embodied carbon than concrete frames due to steel’s higher strength-to-weight ratio. The concrete slab element in any multi-storey building typically dominates embodied carbon regardless of frame material.

    What is the most sustainable alternative to concrete? For structural applications, cross-laminated timber (CLT) offers the largest carbon reduction potential — it sequesters carbon during its service life. For foundations and slabs, there is no viable structural alternative to concrete; the practical path is lower-carbon concrete using GGBS or fly ash blends rather than substituting a different material entirely.

    Does using fly ash or slag reduce concrete carbon? Yes, significantly. Replacing 30% of cement with fly ash reduces embodied carbon by approximately 25–30%. Replacing 50% with GGBS reduces it by 45–50%. Both reduce heat of hydration, which benefits mass concrete pours, and both are widely accepted by structural codes including ACI 318 and Eurocode 2 within defined limits.

    How do I calculate the carbon footprint of my concrete project? Use the Concrete Carbon Footprint Calculator — it requires your concrete volume, mix type, and cement content, and outputs total CO₂e in kg. Compare results across mix designs to see how SCM substitution changes the carbon outcome before finalising your specification.

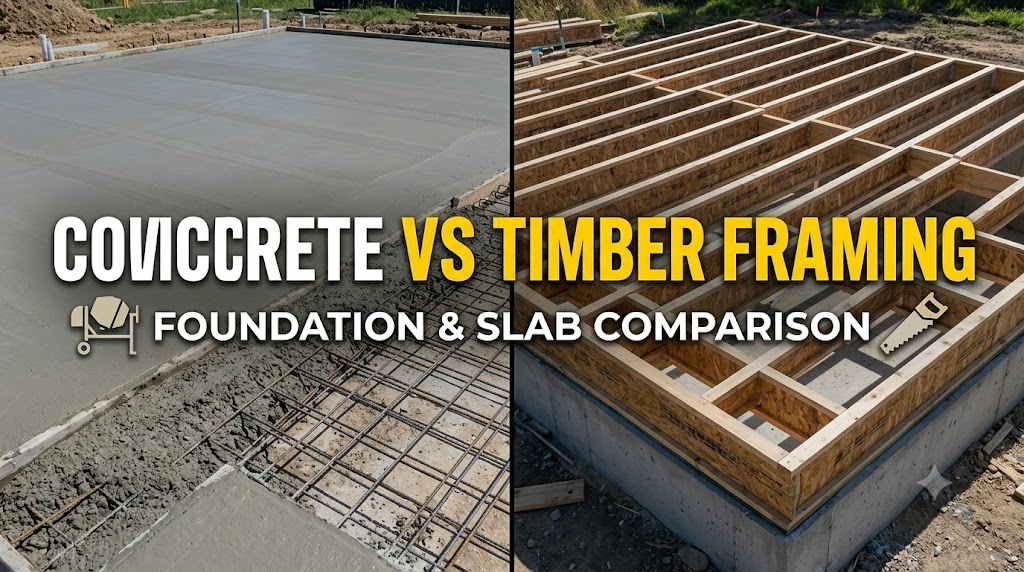
  • Concrete vs Timber Framing: Foundation & Slab Comparison

    Concrete vs Timber Framing: Foundation & Slab Comparison

    For foundations and ground-level slabs, concrete is not competing with timber — it is the only viable structural option in most jurisdictions. The real comparison is concrete slab-on-grade versus timber floor framing elevated over a crawl space or basement, and the decision involves material cost, climate, soil conditions, and long-term maintenance, not just upfront price per square foot.

    Foundation and slab cost comparison: concrete versus timber framing

    The Concrete Cost Per Square Foot Calculator is the fastest way to benchmark slab cost for your specific dimensions, but the table below gives representative installed cost ranges for US residential construction in 2024.

    SystemInstalled Cost (USD/sq ft)LifespanBest Use Case
    Concrete slab-on-grade (4 in / 100 mm)$5–$10Indefinite if maintainedStable soil, warm to moderate climates, garages, basements
    Concrete slab-on-grade (6 in / 150 mm, reinforced)$8–$14Indefinite if maintainedHeavier loads, expansive soils, commercial light industrial
    Timber floor framing over crawl space$12–$2250–100 years (with maintenance)Uneven terrain, cold climates, areas with high frost depth
    Timber floor framing over basement slab$20–$40 (total system)50–80 years (frame)High frost zones, storage/utility space needed below grade
    Concrete post-tensioned slab$12–$18Indefinite if maintainedExpansive clay soils, high shrink-swell potential

    Labour makes up 40–55% of slab installation cost in most US markets. In Canada and Australia, that share is similar; in the UK, ready-mix delivery costs are proportionally higher due to shorter pour windows and urban access constraints. Timber framing labour costs are spread over a longer construction timeline but are not necessarily lower in total.

    Structural and performance differences that actually matter

    Load capacity: A standard 4 in (100 mm) residential concrete slab carries 40–50 psf (1.9–2.4 kPa) live load. A 6 in (150 mm) slab with rebar handles 100 psf (4.8 kPa) or more depending on mix strength and subgrade. Timber floor systems are engineered for specific spans and loads but deflect under point loads in ways concrete does not — relevant for tiled floors, heavy appliances, and garage storage.

    Moisture: Timber framing is vulnerable to moisture intrusion from two directions — ground moisture wicking up from soil and condensation within the crawl space. A properly installed concrete slab with a polyethylene vapour barrier eliminates soil-source moisture entirely. In high-humidity climates (Gulf Coast US, Queensland Australia, British Columbia), crawl space timber frames require active ventilation or encapsulation to prevent rot and mould, adding $3,000–$12,000 to lifetime maintenance cost for an average home.

    Thermal performance: Timber framing creates an insulated air gap under the floor, which matters in climates where floor surface temperature affects comfort. Concrete slabs on grade are thermally massive — they store and release heat slowly, which benefits passive solar design but performs poorly in homes that heat and cool intermittently. Adding 50 mm (2 in) of rigid foam under a slab brings thermal performance close to a framed floor.

    Seismic and wind: Concrete foundations universally outperform timber in seismic and high-wind zones for below-grade elements. Above grade, timber framing with proper shear walls performs competitively in seismic regions — this is why wood-frame construction dominates earthquake-prone areas of the US Pacific Northwest and Japan for residential buildings.

    When concrete wins and when timber framing is the better choice

    Choose concrete slab-on-grade when: soil bearing capacity exceeds 1,500 psf (72 kPa), frost depth is under 600 mm (24 in), the site is level or lightly sloped, you need a garage floor or warehouse slab, or you are building in a termite-active region where elevated timber framing requires ongoing chemical treatment.

    Choose timber framing with crawl space or basement when: frost depth exceeds 600 mm (24 in) — at which point a full perimeter foundation for a slab costs nearly as much as framing anyway — terrain is steeply sloped and cut-and-fill grading is expensive, or the homeowner needs below-grade utility space. In frost zones across the Upper Midwest and Canada, a frost-depth perimeter footing is mandatory regardless of floor system, which eliminates the cost advantage of a slab in those regions.

    Common mistakes in the concrete vs timber foundation decision

    1. Not accounting for frost depth in slab cost. A slab in Boston, Minnesota, or Calgary still requires a perimeter footing extending to frost depth — 42 in (1,067 mm) in Boston, 48 in (1,219 mm) in Minneapolis, and 72 in (1,829 mm) in parts of Alberta. The Frost Depth/Footing Depth Calculator shows required footing depth by location, which directly affects whether a slab or framed system is cost-competitive in your market.

    2. Comparing slab cost per square foot to timber framing cost per square foot directly. These are different systems solving different problems. A slab cost excludes the footing — you need both. A framed floor cost often excludes the foundation wall it sits on. Total system cost, including foundation, is the only valid comparison.

    3. Ignoring expansive soil conditions. In soils with high clay content — common across Texas, Colorado, and parts of the UK — standard slab-on-grade performs poorly. Shrink-swell movement cracks unreinforced slabs within 5–10 years. A post-tensioned slab or a pier-and-beam system (elevated timber) is the correct solution. Geotech reports cost $500–$2,000 and are not optional on sites with suspect soil.

    4. Underestimating crawl space lifetime maintenance cost. A timber frame over a vented crawl space requires periodic inspection, re-treatment for pests, vapour barrier replacement every 15–20 years, and sometimes encapsulation if moisture problems develop. These costs are real but often absent from initial comparisons that show timber framing as competitive with concrete.

    Related calculators you might need

    For any slab system, calculating accurate concrete volume is the essential first step — use the Concrete Slab Calculator for flatwork or the Concrete Foundation Wall Calculator for perimeter foundation walls. If you are comparing ready-mix delivery versus bagged concrete for a smaller slab, the Ready-Mix vs Bagged Concrete Cost Calculator gives a direct cost comparison. Frost depth determines footing depth and significantly affects total foundation cost — the Frost Depth/Footing Depth Calculator should be your first stop for any cold-climate project.

    Frequently asked questions

    Is a concrete slab cheaper than a crawl space foundation? In most warm-climate US markets, yes — a slab-on-grade runs $5–$10 per square foot installed versus $12–$22 per square foot for a framed floor over a vented crawl space. In frost zones, the cost gap narrows significantly because a slab still requires a full-depth perimeter footing, eliminating most of the material saving.

    What are the disadvantages of a concrete slab foundation? Plumbing and electrical runs are embedded in the slab and cannot be accessed without cutting concrete. The slab cannot be insulated below as easily as a framed floor, creating thermal bridging in cold climates. Repair of any embedded system is expensive — typically $500–$3,000 per linear foot to cut, excavate, and repair a concrete slab versus simple floor board removal in a framed system.

    Can I build on a concrete slab in a cold climate? Yes, but the slab edge must be insulated and the perimeter footing must extend to local frost depth. A monolithic slab is not suitable in areas with frost depths exceeding 600 mm (24 in) — a frost-protected shallow foundation (FPSF) with subslab insulation can reduce required depth but must meet local code requirements.

    How long does a concrete slab last versus timber framing? A properly installed and maintained concrete slab has an indefinite service life — Roman-era concrete structures are still standing. Timber framing in a well-maintained, dry environment lasts 50–100 years; in high-humidity or pest-active areas without treatment, structural degradation can begin within 20–30 years. Concrete does not rot, warp, or attract termites.

    How do I calculate concrete for a foundation and slab together? Use the Concrete Footing Calculator for the perimeter footings and the Concrete Slab Calculator for the slab volume. Add both totals and apply a 5–10% waste factor for your ready-mix order.

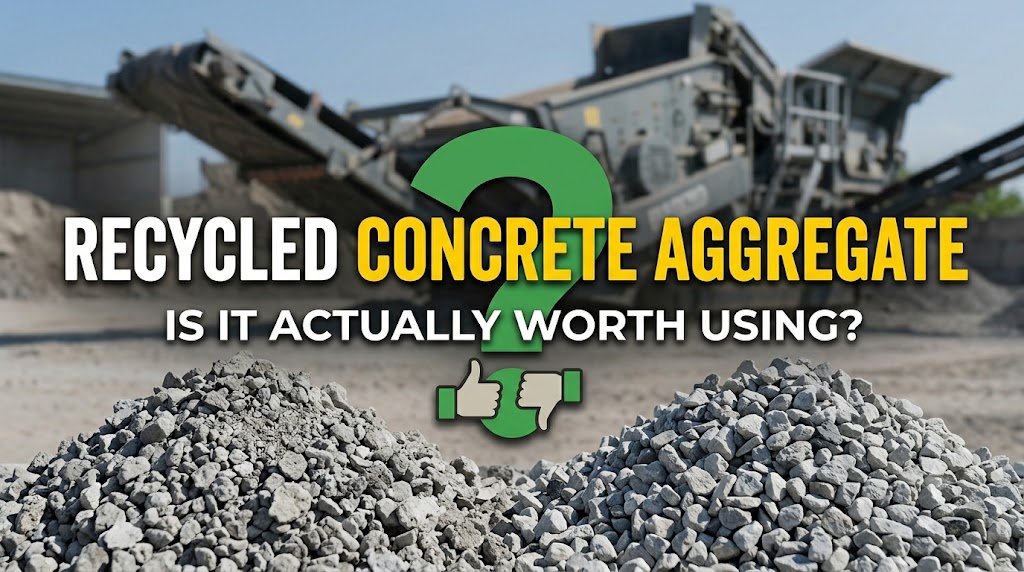
  • Recycled Concrete Aggregate: Is It Actually Worth Using?

    Recycled Concrete Aggregate: Is It Actually Worth Using?

    Recycled concrete aggregate (RCA) costs 20–40% less than virgin crushed stone in most North American and European markets, and it diverts demolition waste from landfill. But those savings come with real trade-offs in strength, absorption, and long-term durability that make it unsuitable for several common applications. Whether it is worth using depends entirely on what you are building.

    What is recycled concrete aggregate and how is it produced?

    RCA is crushed demolition concrete — broken slabs, foundations, pavements, and structural elements — processed through jaw crushers, screened for size, and stripped of embedded rebar. The output is a coarse aggregate that ranges from 4 mm to 40 mm (3/16 in to 1.5 in), with fines sometimes recovered separately as recycled concrete fines (RCF).

    The key difference from virgin aggregate is the residual cement mortar attached to each particle. That old mortar is porous, weaker than the original aggregate, and it drives up water absorption — typically 3–10% for RCA versus 0.5–2% for natural crushed stone. Higher absorption means the water-cement ratio in new concrete is harder to control unless mix water is adjusted at the batch plant.

    If you are calculating material quantities for a project using RCA, use the Recycled Concrete Aggregate Calculator to account for density and volume differences versus virgin aggregate.

    Performance comparison: RCA versus virgin aggregate

    The table below reflects published test data ranges from ACI 555R, RILEM TC 121, and Transport Research Laboratory reports. Actual results depend on parent concrete quality and processing standards at the recycling facility.

    PropertyVirgin Crushed StoneRCA (typical range)
    Compressive strength reductionBaseline0–25% lower at 100% replacement
    Water absorption0.5–2%3–10%
    Bulk density1,550–1,650 kg/m³1,150–1,450 kg/m³
    Drying shrinkageBaseline20–50% higher
    Freeze-thaw resistanceBaselineReduced without air entrainment
    Typical cost saving20–40% per tonne

    Using 30% RCA replacement — the threshold most codes allow without special design provisions — the strength penalty is generally under 10%, which is acceptable for most non-structural applications. At 100% replacement, the compressive strength drop reaches 20–25% and drying shrinkage becomes a significant durability concern.

    Where RCA performs well and where it does not

    Suitable applications include sub-base and base course for roads and driveways, fill under slabs-on-grade, non-structural backfill, drainage layers, and concrete for low-load flatwork such as footpaths, shed pads, and residential driveways where a minimum strength of 20 MPa (2,900 psi) is sufficient.

    Unsuitable applications include reinforced structural elements (columns, beams, load-bearing slabs), prestressed concrete, concrete exposed to aggressive freeze-thaw cycles without air entrainment correction, marine or sulfate-exposure environments, and any element requiring a water-cement ratio below 0.45 without careful pre-soaking of the RCA.

    The porosity issue is manageable: pre-soaking RCA to saturated-surface-dry (SSD) condition before batching is the standard mitigation. Skipping this step causes the aggregate to absorb mix water mid-batch, effectively increasing the water-cement ratio after the truck leaves the plant — a common cause of below-spec strength results in RCA mixes.

    Common mistakes with recycled concrete aggregate

    1. Using ungraded or contaminated RCA. Site-crushed concrete mixed with brick, tile, asphalt, or gypsum wallboard causes unpredictable expansion and strength loss. Always source RCA from a licensed facility with grading certificates. Uncontrolled site crushing is not equivalent to processed RCA.

    2. Ignoring mix water adjustment. RCA absorption ranges from 3–10% versus 0.5–2% for virgin aggregate. Using the same mix design without adjusting total water results in a stiffer mix on-site and actual effective water-cement ratios lower than specified — or, if extra water is added at the truck, a weaker mix. The Water-Cement Ratio Calculator lets you recalculate effective w/c ratio when aggregate absorption changes.

    3. Specifying 100% RCA replacement for structural work. Most building codes (ACI 318, Eurocode 2, BS 8500) either prohibit or require specific design modifications for 100% coarse RCA replacement in structural concrete. A 30% partial replacement is the safe default that requires no special code treatment in most jurisdictions.

    4. Overlooking drying shrinkage. RCA concrete shrinks 20–50% more than equivalent virgin aggregate mixes. Ignoring this in slab design means joints may be spaced too widely, and cracking between control joints becomes likely. Reduce joint spacing by 15–20% compared to your normal spacing for RCA flatwork above 50% replacement.

    Related calculators you might need

    After confirming RCA suitability, the next step is calculating your concrete volumes. The Concrete Slab Calculator handles flatwork dimensions, while the Concrete Mix Ratio Calculator lets you adjust aggregate proportions for a blended RCA mix. If you are recycling your own demolition concrete and want to understand the cost offset, the Concrete Recycling Savings Calculator quantifies the landfill and material cost savings. Projects using RCA in sub-base applications often need gravel volume estimates alongside — the Gravel/Crushed Stone Calculator covers that.

    Frequently asked questions

    Is recycled concrete aggregate as strong as regular gravel? For sub-base use, yes — compacted RCA performs comparably to virgin crushed stone as a base course and is accepted by most highway specifications. In concrete mixes, coarse RCA at 30% replacement produces negligible strength loss. At 100% replacement, expect 15–25% lower compressive strength depending on parent concrete quality.

    Can I use crushed concrete as a base for a driveway? Yes, and this is one of the best applications for RCA. Crushed concrete compacts well, drains adequately, and meets most residential and light commercial sub-base specifications. Use a 100 mm (4 in) minimum depth for light vehicles and 150 mm (6 in) for heavier loads. Confirm the material is free from asphalt, brick, and contaminated fill.

    What percentage of RCA is allowed in structural concrete? ACI 555R allows up to 30% coarse RCA replacement in structural concrete without additional design modifications. Eurocode guidance through national annexes typically allows 20–50% depending on the exposure class. Exceeding these thresholds requires engineer review and mix design testing.

    Does RCA concrete need more cement? Often, yes. To compensate for strength reduction and higher shrinkage at high replacement rates, mix designs typically increase cement content by 5–15% when using 50% or more RCA. This partially offsets the cost advantage of recycled aggregate, which is why the economic case for RCA is strongest at 20–30% replacement rates.

    How do I calculate how much RCA I need for a project? Use the Recycled Concrete Aggregate Calculator — it accounts for the lower bulk density of RCA (typically 1,200–1,450 kg/m³ versus 1,600 kg/m³ for crushed stone), so volume and tonnage outputs are accurate for ordering purposes.