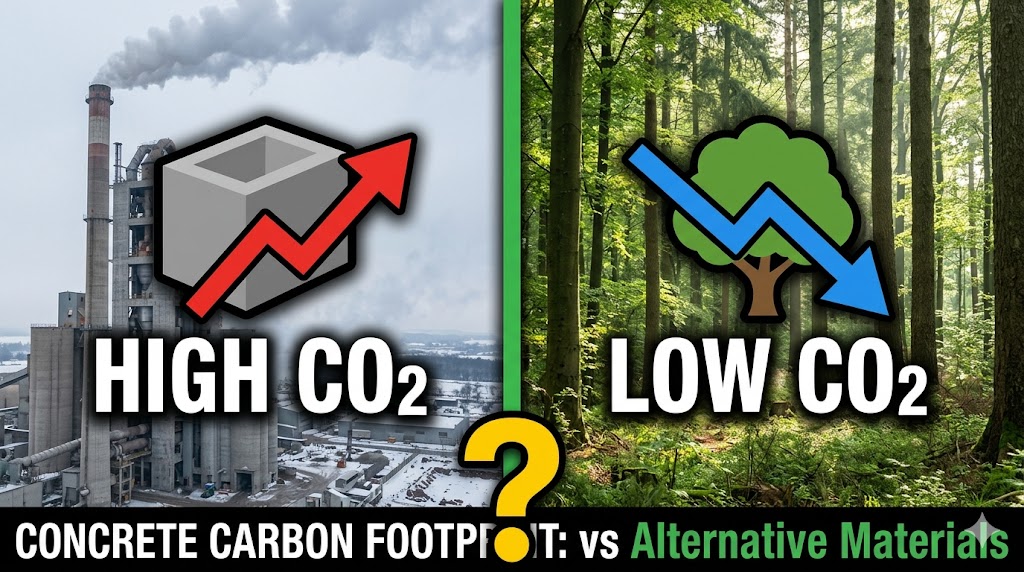
Ordinary Portland cement (OPC) concrete produces approximately 0.8–1.0 kg CO₂e per kg of cement, making cement production responsible for roughly 8% of global CO₂ emissions. On a per-kilogram basis, structural steel is roughly twice as carbon-intensive to produce, and primary aluminium roughly thirteen times worse — while timber can be carbon-negative if sourced from sustainably managed forests. But material choice for construction is never made on embodied carbon alone — and the numbers change dramatically based on design lifespan, replacement cycles, and what you count in the system boundary.
- The per-kg and per-tonne-of-installed-material comparisons tell different stories — concrete looks worse per kg of cement, much better once diluted by aggregate into finished concrete.
- SCM blends (GGBS, fly ash) are the highest-leverage, lowest-effort carbon reduction available — often with no strength penalty.
- Whole-life carbon, not upfront carbon, is the right comparison for anything with a multi-decade service life.
- There’s no structural substitute for concrete in foundations and slabs — the practical lever is a lower-carbon mix, not a different material.
How to measure concrete carbon footprint: the numbers you need
Embodied carbon is measured in kg CO₂ equivalent per cubic metre (kg CO₂e/m³) for volume-based materials like concrete, or per tonne for structural comparisons. The figures below are cradle-to-gate (extraction through manufacture, excluding transport and installation) based on published Environmental Product Declarations (EPDs) and the Inventory of Carbon and Energy (ICE) database v3.0.
| Material | Embodied Carbon (kg CO₂e/tonne) | Embodied Carbon (kg CO₂e/m³) | Structural Use Notes |
| Standard concrete (25 MPa / 3,600 psi) | ~130 | 310–340 | Slab, footing, general structural |
| High-strength concrete (50 MPa / 7,250 psi) | ~180 | 440–480 | Columns, bridges, parking structures |
| Concrete with 50% GGBS replacement | ~65 | 155–175 | Reduced clinker, lower early strength |
| Concrete with 30% fly ash replacement | ~90 | 215–235 | Common SCM blend, widely available |
| Structural steel (virgin) | ~1,770 | 13,900 | Beams, columns — very high density |
| Structural steel (recycled content >80%) | ~480–700 | 3,760–5,490 | Electric arc furnace, varies by grid |
| Cross-laminated timber (CLT) | -750 to -1,600 (biogenic) | ~250–400 (cradle-to-gate excl. carbon storage) | Sequesters carbon while in use |
| Aluminium (primary) | ~11,500 | 31,050 | Rarely structural; cladding, frames |
| Fired clay brick | ~240 | 430–510 | Masonry walls |
| Autoclaved aerated concrete (AAC) block | ~350 | 190–220 (low density ~600 kg/m³) | Non-structural and light structural |
To calculate the actual carbon output for a specific concrete project, use the Concrete Carbon Footprint Calculator — it outputs total CO₂e based on volume, mix design, and cement type. If you’re comparing mixes across PSI and MPa specs, the PSI to MPa Converter keeps the strength classes in the table above aligned with your project’s spec.
Why a direct per-tonne comparison between concrete and alternatives is misleading
Structural materials are not interchangeable by mass. A concrete slab, a steel beam, and a CLT panel serving the same structural function contain different volumes and masses of material. The correct comparison is functional unit — the carbon required to achieve a specific structural outcome, not the carbon per tonne of each material in isolation.
Concrete versus steel: Steel has roughly 13 times higher embodied carbon per tonne than standard concrete. However, steel’s high strength-to-weight ratio means far less of it is used to achieve the same load capacity. A steel-framed multi-storey building typically has lower total embodied carbon in the structural frame than an equivalent concrete frame — but the slab, which is almost always concrete regardless of frame material, often dominates total material carbon.
Concrete versus timber (CLT): CLT stores biogenic carbon during its service life, making it carbon-negative on a cradle-to-gate basis when carbon sequestration is included. However, this carbon is released if the timber is burned or landfilled at end of life. The carbon benefit is time-bound and recovery-dependent. In a 60-year building lifespan, CLT may represent a genuine carbon advantage; in a 100-year concrete structure that outlasts multiple timber replacement cycles, the advantage narrows or reverses.
Concrete versus AAC block: Autoclaved aerated concrete has lower embodied carbon per cubic metre than standard concrete due to its cellular structure and lower density, and it performs significantly better thermally. For non-structural partition walls and low-rise residential, AAC is a compelling alternative on both carbon and energy performance grounds. It does not compete with structural concrete on compressive strength.
Strategies that actually reduce concrete carbon footprint
Supplementary cementitious materials (SCMs): Replacing 30% of Portland cement with fly ash (pulverised fuel ash / PFA) reduces embodied carbon by approximately 25–30%; replacing 50% with ground granulated blast-furnace slag (GGBS) reduces it by 45–50% — both with minimal impact on 28-day strength. GGBS mixes are already standard in UK infrastructure (BS 8500 CEM II/III mixes). Both are industrial by-products that would otherwise require disposal. Because SCMs change the water-to-binder relationship rather than the water-to-cement relationship, revisit the Water-Cement Ratio Calculator when specifying a blended mix — codes typically govern durability by w/b, not w/c, once SCMs are in the mix.
Optimised mix design: Over-specification of concrete strength is common — using 40 MPa (5,800 psi) concrete where 25 MPa (3,600 psi) is structurally adequate adds roughly 25–40% embodied carbon for no structural benefit. Matching mix strength to actual design loads rather than defaulting to a high-strength mix is the simplest carbon reduction available. The Cement Quantity Calculator shows exactly how much extra cement (and therefore carbon) each grade step actually costs for your volume.
Reduce volume through structural efficiency: Thinner slabs with post-tensioning, ribbed slab systems, and optimised column grids use less concrete to achieve the same performance. Post-tensioned slabs are typically 20–30% thinner than equivalent reinforced concrete slabs, reducing embodied carbon proportionally. The Concrete Slab Thickness Selector helps identify the minimum structurally adequate thickness for your loading scenario.
Recycled aggregate: Substituting recycled concrete aggregate (RCA) for virgin crushed stone doesn’t reduce cement-related carbon directly, but it cuts the emissions associated with quarrying and transporting virgin aggregate, and diverts demolition waste from landfill. The Recycled Concrete Aggregate Calculator covers the volume side of that substitution — see our RCA guide for the strength and durability trade-offs involved.
Concrete carbonation (reabsorption): Over its service life, concrete reabsorbs CO₂ from the atmosphere through a natural process called carbonation. A widely cited study in Nature Geoscience (2016, Xi et al.) estimated that global concrete carbonation between 1930 and 2013 reabsorbed approximately 43% of the CO₂ released from cement calcination over that period — not counted in cradle-to-gate figures but relevant to whole-life assessments.
Common mistakes in concrete carbon comparisons
1. Comparing cradle-to-gate figures across different system boundaries. Some material EPDs include transport and installation (cradle-to-practical completion); others stop at factory gate. Comparing a cradle-to-gate concrete figure against a cradle-to-practical-completion CLT figure overstates the timber advantage. Always confirm what the system boundary includes before drawing conclusions.
2. Ignoring service life and replacement cycles. A concrete structure with a 100-year design life versus a timber alternative requiring structural replacement or retreatment at 40–50 years means the concrete is producing one set of embodied carbon emissions against two or more cycles of timber production. Whole-life carbon accounting, not upfront carbon only, is the correct metric for long-lived structures.
3. Treating biogenic carbon in timber as permanently sequestered. CLT’s carbon storage only benefits the climate if the wood is not burned or landfilled at end of life. End-of-life scenarios for buildings are difficult to predict over 50-100 year timescales. Carbon sequestration in buildings should be counted conservatively, especially in jurisdictions without established timber salvage or cascade-use infrastructure.
4. Not accounting for the concrete already in the building. Structural steel frames still use concrete for slabs, foundations, and cores. Labelling a building as a ‘steel structure’ or ‘timber structure’ does not eliminate concrete’s carbon contribution — it just relocates it. Whole-building carbon accounting is the only way to compare construction systems accurately.
Related calculators you might need
The Concrete Carbon Footprint Calculator is the starting point for project-level carbon quantification. If you are evaluating whether recycled content concrete or GGBS blends change your numbers, the Concrete Mix Ratio Calculator lets you adjust cement proportions before running carbon estimates. Demolition and material substitution decisions often involve assessing whether existing concrete can be recycled — the Concrete Recycling Savings Calculator quantifies the carbon and cost benefit of crushing and reusing demolition concrete on-site. For projects comparing concrete versus asphalt specifically, the Concrete vs Asphalt Driveway Cost Comparison covers both cost and lifecycle context.
Frequently asked questions
How much CO₂ does concrete produce per cubic metre? Standard 25 MPa (3,600 psi) ready-mix concrete produces approximately 310–340 kg CO₂e per cubic metre at the point of manufacture. High-strength 50 MPa (7,250 psi) mixes reach 440–480 kg CO₂e/m³. Mixes using 50% GGBS replacement drop to 155–175 kg CO₂e/m³ — roughly half the carbon of standard OPC concrete.
Is concrete worse for the environment than steel? Per tonne, structural steel is roughly 13 times more carbon-intensive than standard concrete. Per functional unit (achieving the same structural outcome), the comparison is closer, and steel-framed buildings can have lower frame embodied carbon than concrete frames due to steel’s higher strength-to-weight ratio. The concrete slab element in any multi-storey building typically dominates embodied carbon regardless of frame material.
What is the most sustainable alternative to concrete? For structural applications, cross-laminated timber (CLT) offers the largest carbon reduction potential — it sequesters carbon during its service life. For foundations and slabs, there is no viable structural alternative to concrete; the practical path is lower-carbon concrete using GGBS or fly ash blends rather than substituting a different material entirely.
Does using fly ash or slag reduce concrete carbon? Yes, significantly. Replacing 30% of cement with fly ash reduces embodied carbon by approximately 25–30%. Replacing 50% with GGBS reduces it by 45–50%. Both reduce heat of hydration, which benefits mass concrete pours, and both are widely accepted by structural codes including ACI 318 and Eurocode 2 within defined limits.
How do I calculate the carbon footprint of my concrete project? Use the Concrete Carbon Footprint Calculator — it requires your concrete volume, mix type, and cement content, and outputs total CO₂e in kg. Compare results across mix designs to see how SCM substitution changes the carbon outcome before finalising your specification.
Embodied carbon figures above are representative ranges from published EPDs and the ICE database; actual figures vary by region, grid electricity mix, cement source, and specific product EPD. Use project-specific EPDs for formal carbon accounting or certification submissions rather than these general figures.